Cancer kills several million people each year worldwide. However, some studies [1] have shown that the date of cancer diagnosis has a significant impact on the likelihood of cure for some cancers. In addition to seeking treatment, it is also important to make the diagnosis effective in order to catch the cancer as early as possible.
For several years, a lot of work has been done to include artificial intelligence in the medical field, in particular to help speed up diagnosis and facilitate therapeutic decisions. However, the effective and operational integration of AI remains a challenge, notably because of certain aspects of data management and quality, computing infrastructures and the validation of AI technologies. Concerning validation, problems are often linked to the black box aspect of AI: how to validate a functioning that is not explained? Or how to validate it if there is no proof that it works, except for a success rate obtained through statistical evaluations? Saimple aims to answer these validation issues by providing explicability and robustness metrics.
Objectives
In this use case, we will focus on the most common cancer in women: breast cancer. With the help of elements of explicability of neural networks from Saimple, we will try to understand the cases where the model detects a cancer where in reality there is none (false positives) and where the model does not detect a cancer when there is one (false negatives). Thus we can see at which level a model is stable in its classification.
Explanation of the dataset
This use case uses a breast cancer ultrasound dataset. It contains three classes: normal, benign and malignant images.
The number of patients is 600 and the dataset is composed of 680 images:
- 437 images belonging to the “benign” class
- 210 images belonging to the “malignant” class
- 33 images belonging to the “normal” class
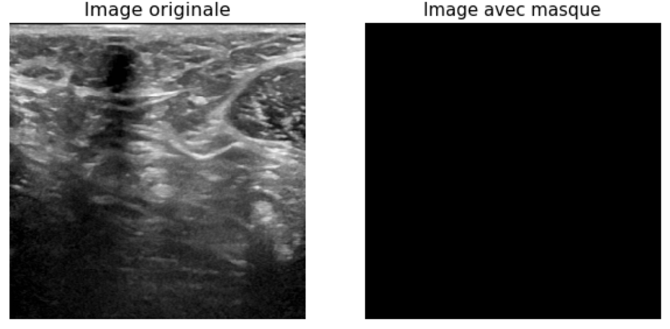
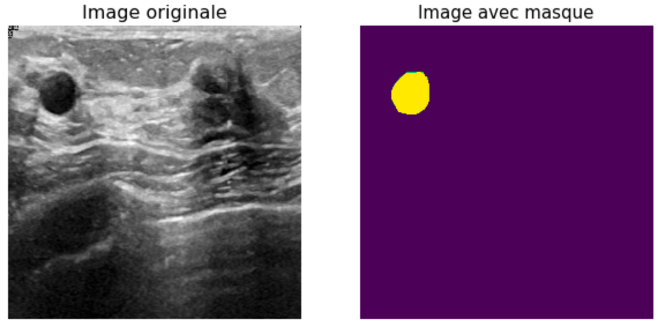
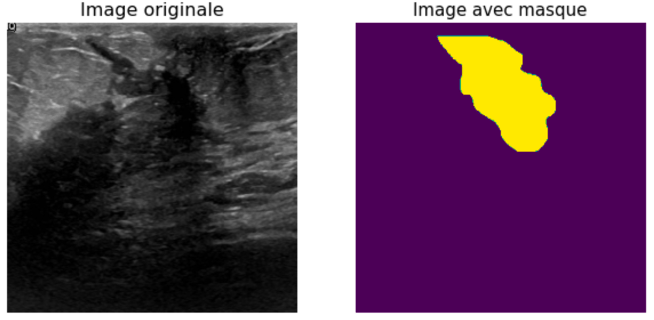
The size of the images is on average 500×500 pixels. Each image is initially associated with another image, which is a mask that allows to localize the tumor in the initial image.
Model results
For this use case, a convolutional neural network model has been selected. There are 3 outputs: benign noted 0, malignant noted 1 and normal noted 2.
This model was trained on balanced data and the images with mask were removed from the training since they could bias the training. The model obtains an accuracy score of 98%.
Then, the model is evaluated with test data summarized in the confusion matrix below.
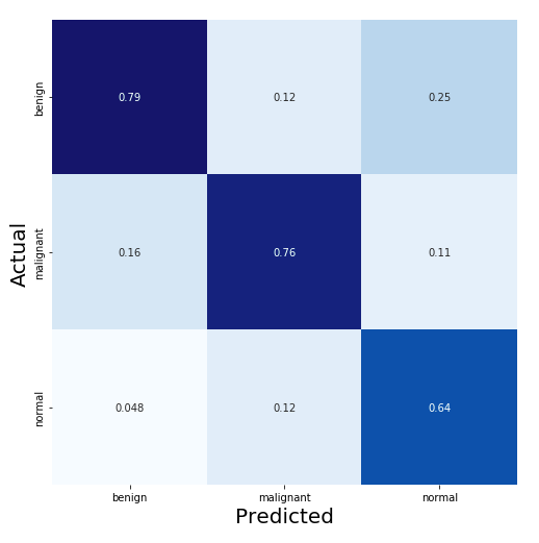
The confusion matrix allows us to compare the actual data for a target variable (y-axis) with those predicted by a model (x-axis). Thus it is possible to identify the type of error that the model makes.
Here, the model tends to classify normal images less well (64% success rate) and to confuse, with a non-negligible rate, an ultrasound containing a benign tumor with an ultrasound without any tumor (25% of images predicted as normal that were in reality benign tumors). For an ultrasound containing a malignant tumor, the model quite often classifies it as benign or normal. But why is the model wrong?
Before proceeding with the analysis to answer this question, it is necessary to understand how a benign tumor is visually differentiated from a malignant tumor.
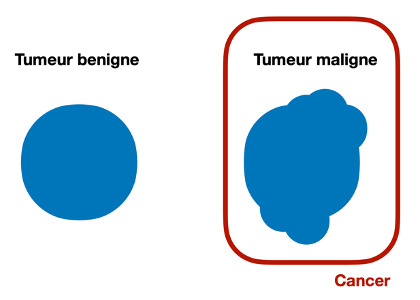
A benign tumor is a very regular mass as opposed to a malignant tumor which is irregular. Ultrasound can be a good indicator to detect a mass and differentiate between the two types of tumor.
Benign tumors are clusters of cells that are controlled because they are held together by a circular capsule that prevents them from spreading. They are therefore considered to be non-dangerous.
The malignant tumor is a cluster of cancerous cells that is dangerous because it can grow in any part of the body, so the cancerous cells spread uncontrollably.
Using Saimple, we will be able to continue the analysis to see if the model has identified the characteristics of both types of tumor to classify the images.
Saimple results
Saimple provides two types of results:
Relevance: identifies the important pixels that allowed the model to classify the image. A pixel is considered important when a value called “relevance” is higher than the average. The more this value tends towards red or blue, the more the pixel is considered important.
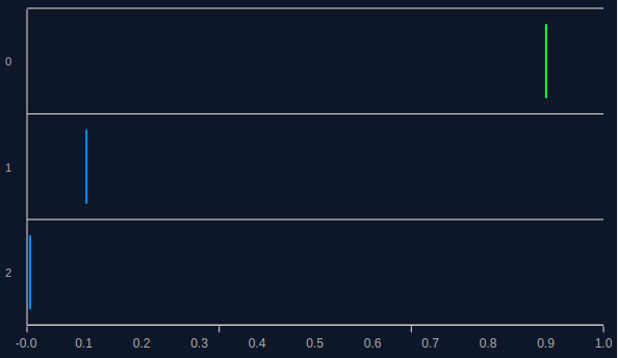
Dominance: indicates in the form of intervals of scores belonging to a possible class of the model on the space of the inputs considered. The dominance graph allows to determine if a class is dominant, i.e. if the predicted value of this class will always be higher than the scores of the other classes. A dominant class ensures that the decision of the model (good or bad) will remain stable. Therefore, the network will always predict the same class, for all the images that can be generated from the original image and the given noise. It is important to note that the interval values of the classes can overlap without losing the dominance property. Since the interval representation is a projection of the possible values, it does not take into account the constraints that define the compared values.
Image containing a benign tumor
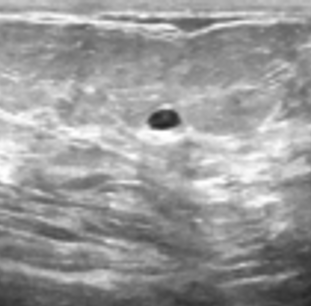
Immediately, we can identify the benign tumor since a well regular mass is visible.
The dominance plot, below, indicates that the model classifies the image in the “benign” class; the model therefore classifies correctly with a very high score (close to 1).
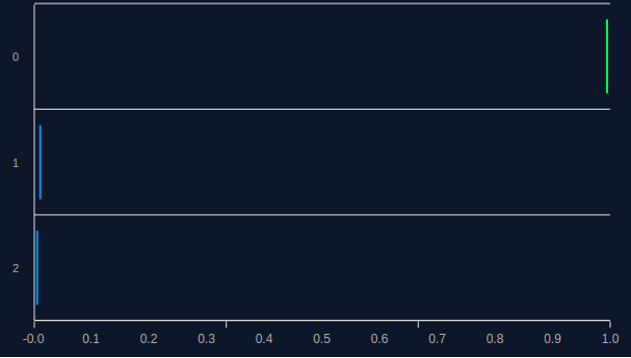
But is the model ranking the image for the right reasons?
The relevance, below, allows visualizing the elements of the image that were used for the decision. As the relevance is located at the edge of the tumor, we can assume that the model has classified the image for the right reasons, i.e. by identifying the contour of the tumor.
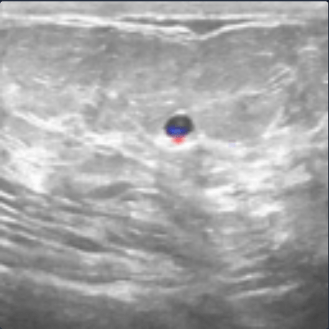
In this first analysis, we also notice a difference in black intensity between the tumor and the rest of the tissue. It is then possible to wonder if the model is interested in the darker pixels.
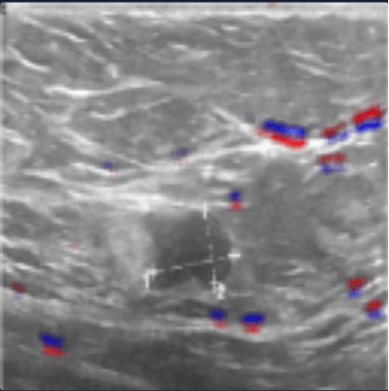
Image containing malignant tumor
In the image above, the malignant tumor is quickly identifiable because it is located in the center of the image.
The dominance plot, below, indicates that the model classifies the image as “malignant”; the model therefore classifies correctly with a very high score (close to 1).
The image is well classified but according to the relevance below, the model focused on the extremities of the image and the outline of the tumor.
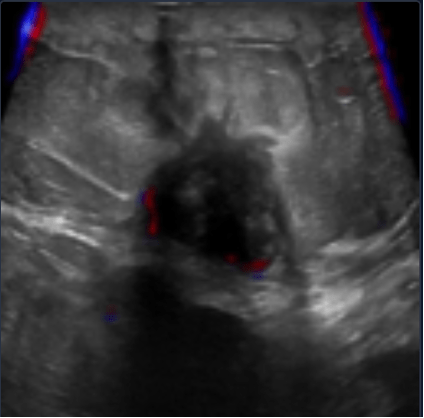
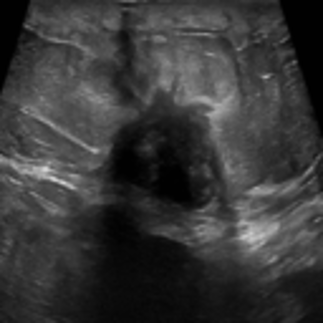
Image containing a malignant tumor including bias
Thus, questions arise about the detection performed by the neural network. Perhaps the elements on which the algorithm bases its decisions are not medically relevant. It is necessary to make sure that the algorithm is based on elements on which doctors would base themselves, to be sure of the validity of the system and to avoid classification errors as much as possible.
Thus, further analysis is required. When analyzing the dataset more precisely, it can be noticed that some images include biases, such as text or tumor measurement elements.
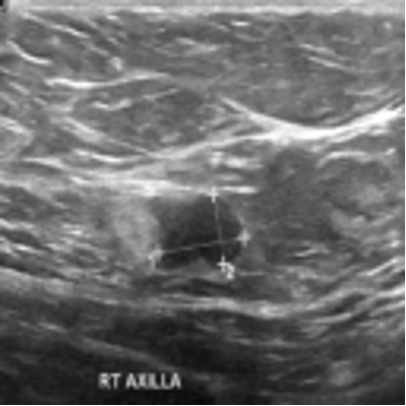
Let’s use Saimple to identify whether the model is using bias to classify the image.
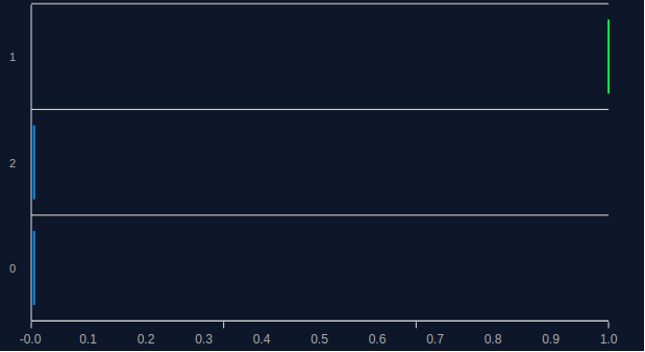
The dominance graph, as before, allows us to check if the model correctly classifies the image with stability.
The model correctly classifies the image but the relevance, below, indicates that the model does so for the wrong reasons. The tumor outline is clearly not used to classify the image.
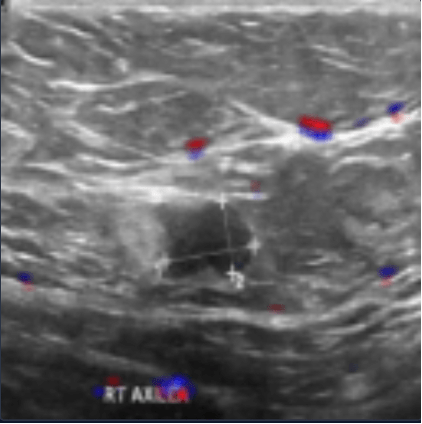
Relevance allows us to make a hypothesis: the text allowed the model to correctly classify the image.
To continue the analysis, the text is removed to see if the model still correctly classifies the image with the same dominance score. Thanks to the Saimple tool, it was identified that the model has taken into account the bias in its classification. Thus, by removing this bias it is expected that the model changes its classification. A verification is then performed by taking the same image without the text.
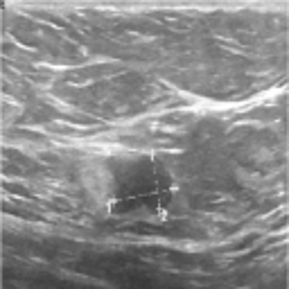
The relevance, below, shows that the tumor contour was still not identified by the model to classify the image.
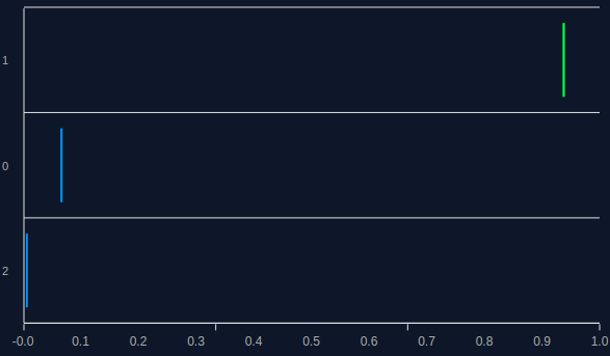
The dominance graph indicates that the model does not classify the image correctly, and this with a high certainty score.
Thus, by removing the text, the model changed its classification and the relevance shows that the model did not identify the tumor. This indicates that the model is not robust, so we need to remove the bias in the images and re-train the model.
Conclusion
Cancer detection is an important issue, but it is essential to reduce diagnostic errors: false positives leading to unnecessary treatment or false negatives leading to non-detection of cancer with a probable negative evolution of the latter.
Through this case study, it was shown that a good accuracy, i.e. higher than 0.8 during training, does not necessarily imply that the model has learned well and for good reasons. Indeed, Saimple was able to identify that the model focuses on biases contained in the image and, by removing these biases, the model changes its classification. Thanks to Saimple, it was therefore possible to identify a biased dataset. But it is also possible to monitor the re-training of the network to ensure that the biases are really removed.
Moreover, concerning the validation of algorithms, another element can be put forward. Indeed, software verifications are very interesting but there may also be a need to double them. In the field of medicine, a cancer detection on ultrasound is not enough, doctors double the diagnosis by a microscopic study to see if a mass is cancerous. In order to save time for the doctor, it would also be possible to perform this second validation by an AI, and to only involve the doctor at the end of the loop, to confirm the diagnosis with the results of the two evaluations and thus to validate the decision-making. In this way, AI algorithms can work in combination, but this operation can make their validation and acceptance even more difficult. Safety issues are critical, which is why Saimple aims to help validate AI systems, by providing concrete proof of robustness and explainability; to finally assist physicians in their analysis by allowing them to have confidence in the use of AI.
References
Authors


